Cyclic Spectroscopy
Cyclic spectroscopy is a technique for characterising signals which are, well, cyclic. That is, signals which are periodic in some way: they repeat over and over again, on a particular time-scale. Here's an example in which the amplitude of a signal is modulated with a particular period:
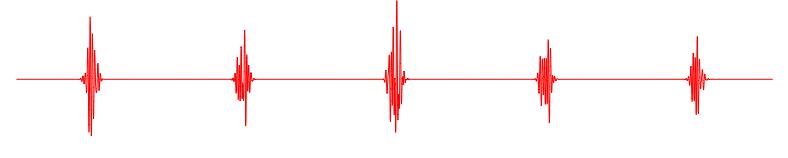
In the case shown above the modulation is very strong and the signal is concentrated into a short interval within each period; in other words, the signal is pulsed. This type of behaviour is very similar to the radio-wave signals which are received from a particular type of astronomical source known as - surprise! - a "pulsar".
When the amplitude of a signal is periodically modulated, its spectrum changes slightly: for each pure tone (i.e. single frequency) in the original signal, the modulated signal has one or more pairs of additional components, at frequencies which differ from the pure tone by multiples (1x, 2x, 3x, …) of the pulsing frequency. (The pulse frequency is the reciprocal of the pulse period so, e.g., if the pulse period is 0.2 seconds then the pulse frequency is 5 Hertz, or 5 pulses per second.) One component of each pair has a higher frequency than the pure tone, and one has a lower frequency; in engineering lingo these are referred to as "upper- and lower-sidebands".
The presence of sidebands opens up some new possibilities. To make accurate measurements of the signal strength we need to take a product of the signal with itself - because that quantity can be averaged over time, whereas the average of the signal itself is zero. If there were no sidebands there would only be one such quantity that we could form at any given frequency, and that's the squared amplitude of each pure tone at that frequency. That's what you'd call "conventional spectroscopy" - we measure how much signal power there is at each frequency. But when the signal is modulated, at each frequency we have both a lower-sideband and an upper-sideband, so we can form the product of those two - that's cyclic spectroscopy.
Cyclic spectroscopy has been in use for some time in engineering contexts - e.g. to study the acoustic signals in a car's engine, because those signals are modulated by the periodic motion of the pistons in the engine. It was brought into astronomy in 2008 by Paul Demorest (National Radio Astronomy Observatory, U.S.A.), who recognised that cyclic spectroscopy is perfectly suited to characterising the signals of radio pulsars. Paul subsequently joined forces with Willem van Straten (Auckland Uni of Technology) and Manly Astrophysics to develop the application of cyclic spectroscopy to pulsars.
Because the cyclic spectrum is formed from the product of two distinct signals (upper- and lower-sidebands), the result depends both on the amplitude of those signals and on the amount by which one of the sidebands leads, or lags, the other - we call this quantity the "phase". For conventional spectroscopy (no modulation, so no sidebands) the phase is always zero because each measurement is the product of a signal with itself. By contrast, cyclic spectroscopy gives us both the amplitude and the phase for each of the sideband-pairs (1, 2, 3… times the pulse frequency) that we use. We can measure many of these pairs, which gives us a lot of information about the signal - vastly more than conventional spectroscopy - and that's why cyclic spectroscopy is such a useful technique.
There are two particularly important results which we get out of all this information. The first is that we get a measurement of the amplitude and phase of the signal, at each frequency, whereas conventional spectroscopy gives us just the amplitude. The difference is analogous to the difference between holographic and photographic recordings: cyclic spectroscopy is an intrinsically holographic technique. What do we get a hologram of? Well, the radio signals from a pulsar are scattered by lumpiness in the interstellar medium as they propagate to us, so we're doing holography of the interstellar medium.
The second important bit of information that we get is the true shape of the pulses. We can measure pulse shapes without using cyclic spectroscopy, but those aren't the true shapes. The measurement is affected by scattering in the interstellar medium: part of the signal takes longer to arrive, because it travels a slightly longer path, so the pulse is smeared out as it propagates to us. But with cyclic spectroscopy we can precisely quantify the effect of the scattering, and so we obtain a measurement of the pulse profile which is free of the associated smearing. For example: here's the true pulse profile - as determined using cyclic spectroscopy - (in red) for the pulsar B1937+21, shown alongside the profile as it's usually observed - smeared by interstellar scattering (in blue).
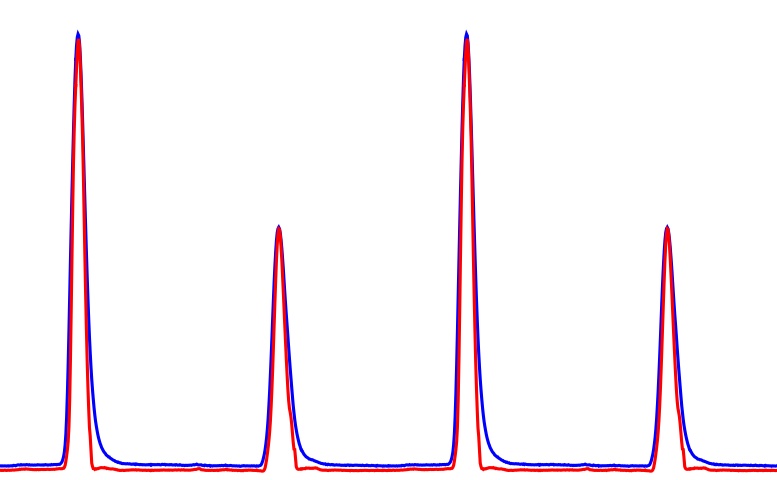
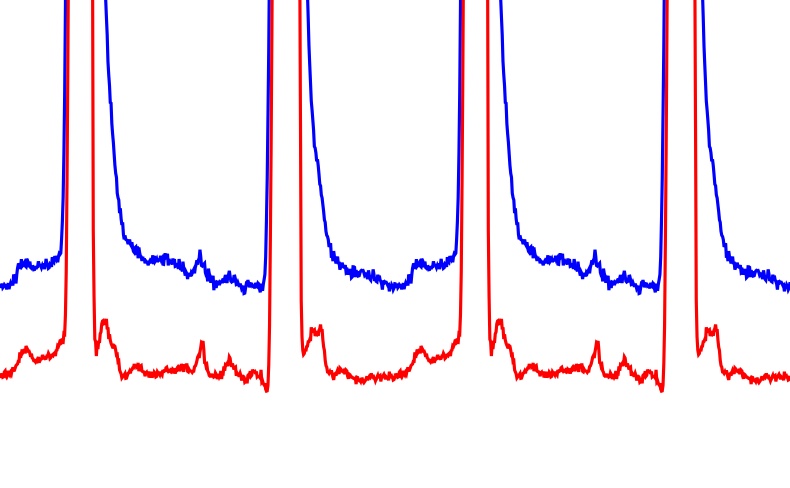
These data were taken with the Arecibo radio telescope. Four complete pulse cycles are shown - each cycle consists of a "main pulse" (the bigger of the two peaks in each cycle) and an "inter-pulse". You can most clearly see the smearing effect of the interstellar scattering at the trailing edge of the main pulse, where scattered radio-waves continue to arrive at the telescope even though the pulsar has largely "turned off" by this point. The same results are shown below, but zoomed in on the baseline, showing that there is structure there too, and revealing many differences between the scattered pulse profile and the true profile determined using cyclic spectroscopy.
Knowing the true profile of the pulses is helpful in trying to understand the physical processes responsible for radio emission in pulsars. Those processes are only poorly understood at present.